Table of Contents
What is Data Analysis?
Data Analysis is the process of looking closely at data (numbers, facts, or information) to understand what it means. Think of it like being a detective who uses clues (data) to solve a mystery (find answers).
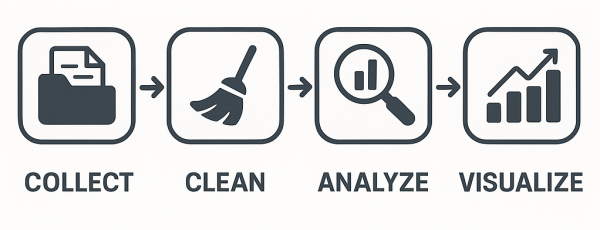
This process usually involves five main steps:
1. Collecting Data – Getting the information you need. This could be from websites, surveys, apps, or sales records.
2. Cleaning Data – Putting the data in order like using tables or spreadsheets, removing errors, fixing mistakes, and making sure the data is correct and ready to be analyzed.
3. Analyzing/Interpreting Data – Studying the data to find trends, patterns, or answers to questions.
4. Visualizing Data – Creating charts, graphs, or dashboards to help others understand the findings quickly.
🧠 Simple Example: Imagine you own a tea shop. You track how many cups of tea you sell each day. By analyzing this data:
- You notice weekends are your busiest days
- You find that ginger tea sells most in winter
- You realize most customers come between 5 PM and 7 PM
This helps you make better decisions like ordering more ginger during winter or hiring an extra helper in the evening.
In short, data analysis helps turn raw numbers into useful stories so you can make smarter choices in work or life.
Why is Data Analysis Important in Today’s World?
We are living in a world where data is being generated all the time—from your phone, computer, shopping apps, health trackers, and even smartwatches.
Whether it’s booking a cab on Ola, ordering food from Zomato, or searching something on Google, data is constantly collected. But just collecting data isn’t useful. It must be analyzed to find meaning and value.
Here’s why data analysis is so important today:
🔹 Businesses
- Companies use data to understand what customers like and dislike.
- Helps them create better products, improve customer service, and increase profits.
- Example: Flipkart uses customer behavior data to show you products you’re most likely to buy.
🔹 Healthcare
- Hospitals use patient data to track diseases, monitor treatments, and predict health issues.
- During COVID-19, data analysis helped track virus spread and vaccine response.
🔹 Governments
- Helps in making better policies and using public money wisely.
- For example, census data helps the government plan for education, transport, or healthcare.
🔹 Education
- Schools and colleges use student performance data to improve teaching.
- Online learning platforms recommend courses based on what learners find difficult.
🔹 Individuals
- You can analyze your spending to manage your budget.
- Fitness apps analyze your steps, sleep, and heart rate to help improve your health.
🎯 In summary:
Data analysis turns huge amounts of information into useful knowledge. It helps people and organizations solve problems, plan ahead, and make better decisions every day.
Types of Data Analysis
Data analysis isn’t just about looking at numbers—it’s about understanding different kinds of questions you can answer using data. There are 4 main types, and each serves a different purpose:
🔹1. Descriptive Analysis – What happened?
- This is the most basic type. It helps you summarize past data to see what’s already happened.

- 🧾 Example:
A business checks its monthly sales report to see how much they sold last month.
🔹 2. Diagnostic Analysis – Why did it happen?
- This digs deeper into the data to find reasons behind trends or issues.
- 🔍 Example:
If user sign-ups suddenly drop, a company looks into website changes or ad campaigns that might have caused it.
🔹 3. Predictive Analysis – What is likely to happen next?
- This uses past data to predict future outcomes.
- 📈 Example:
An e-commerce site predicts that winter jackets will sell more in December based on past years’ trends.
🔹 4. Prescriptive Analysis – What should we do now?
- This gives actionable suggestions based on data.
- 🛠️ Example:
A marketing team uses data to decide the best time and platform to launch a new product ad.
In short:
- Descriptive = Past
- Diagnostic = Reason
- Predictive = Future
- Prescriptive = Advice
Each type plays a key role in helping people and businesses make smarter decisions using data.
Common Steps in the Data Analysis Process
The data analysis process may sound technical, but it follows a clear step-by-step path. Here’s how you can understand it easily
🔹 1. Define Your Objective
- Ask yourself: What do I want to find out?
- For example, a business might want to know why online orders have dropped this month.
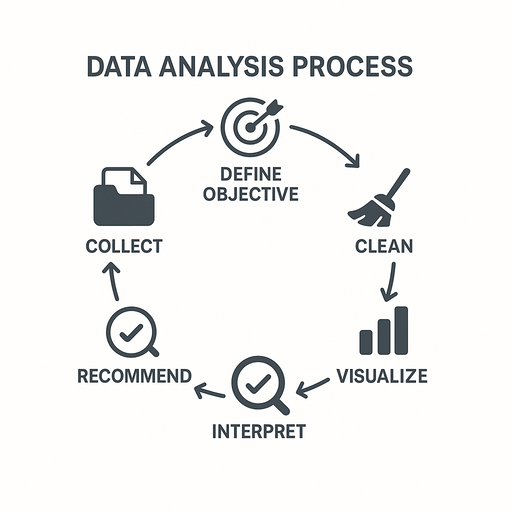
🔹 2. Collect Data
- Once you know your goal, you gather the data you need.
- It could come from surveys, websites, spreadsheets, sales records, or apps.
🔹 3. Clean and Preprocess Data
- Raw data is usually messy. You must fix errors, remove duplicates, and fill missing values.
- This step makes sure your data is reliable.
🔹 4. Analyze Using Statistical Tools
- Now, you dig into the data using formulas, graphs, or coding tools to find patterns or trends.
🔹 5. Visualize With Charts/Dashboards
- Use graphs, pie charts, and dashboards to make the data easy to understand.
- Tools like Excel, Power BI, or Tableau help a lot here.
🔹 6. Interpret Results
- Look at your analysis and ask: What is this data telling me?
- For example, if sales dropped when ad spending was cut, the connection becomes clear.
🔹 7. Make Recommendations
- Finally, you give useful suggestions based on the insights.
- E.g., “Increase ads in festive season to boost sales.”
This process helps turn messy numbers into clear decisions!
Popular Tools Used for Data Analysis
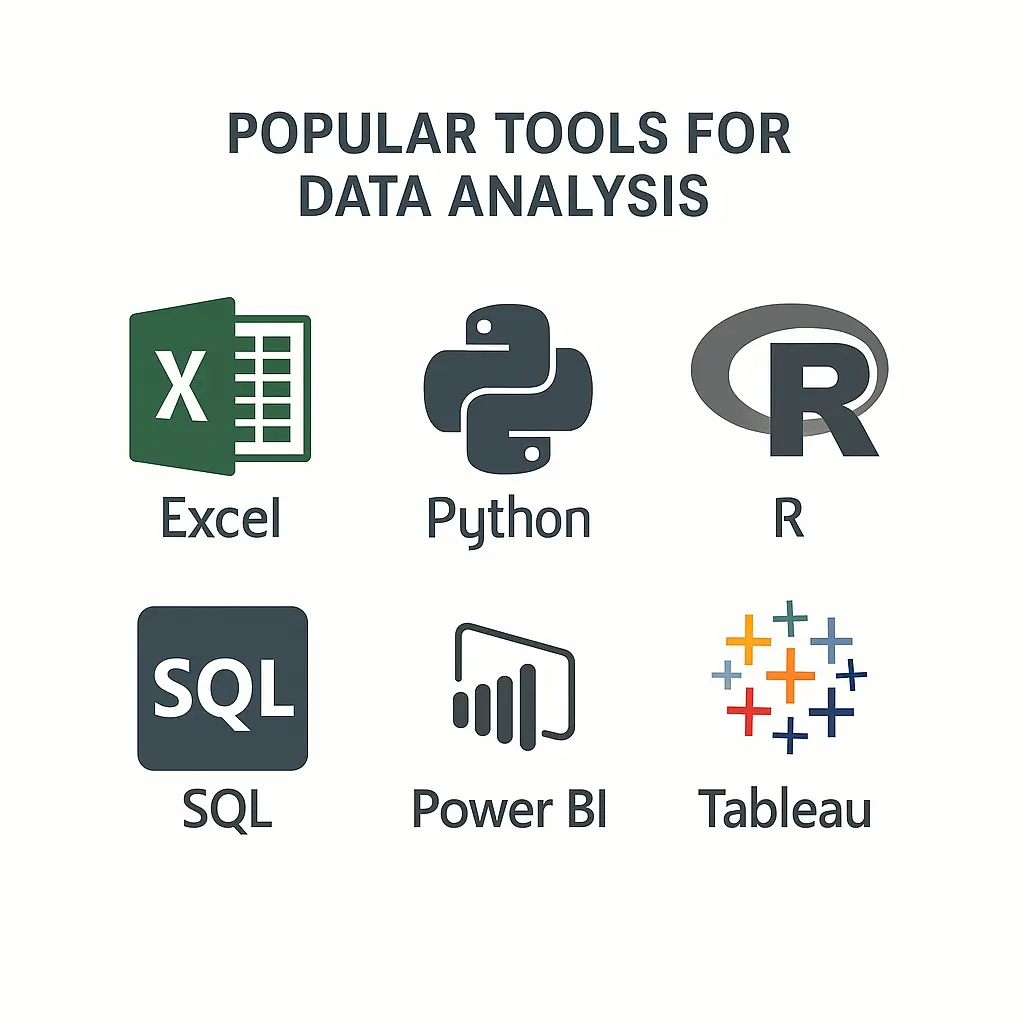
Here are some of the most common tools that data analysts use—and why they matter:
🟢 Excel
- Perfect for beginners!
- Easy to use
- Great for calculations, charts, and organizing data
- Used in almost every company
🟢 Python
- A powerful programming language.
- Used for deep analysis and automation
- Libraries like Pandas and NumPy help with data tasks
- Matplotlib and Seaborn help in creating charts
🟢 R
- Best for people working with statistics.
- Common in research and academics
- Ideal for running statistical tests and creating reports
🟢 Power BI / Tableau
- These are data visualization tools.
- Help you create beautiful dashboards and reports
- Used by companies to show data in an easy-to-read format
🟢 SQL (Structured Query Language)
- Used to talk to databases.
- Helps you pull specific data from large systems
- A must-have skill for every data analyst
📌 Tip for Beginners:
- Start with Excel and SQL, then move to Python and Power BI as you grow.
Real-Life Examples of Data Analysis in Action
Let’s look at how big companies use data analysis in everyday situations:-

Analyzes your watch history, time spent on shows, and ratings to recommend content you’re likely to enjoy. That’s why your homepage looks different from someone else’s—it’s personalized using data.

Uses past purchase data, seasonal trends, and browsing behavior to predict product demand. This helps them manage stock efficiently, avoid shortages, and suggest products you might want.

Tracks customer orders and location data to spot trending dishes and popular restaurants. They then promote these through their app, helping users discover what’s hot in their city.
Key Concepts Every Beginner Should Know
Understanding the following core ideas will help you grasp data analysis more easily:
🔹 Data Cleaning
This means fixing mistakes in your data—like removing duplicate entries, correcting typos, and filling in missing values. Clean data leads to accurate results.
🔹 Data Visualization
This is about using graphs, pie charts, bar charts, or dashboards to show your results clearly. It’s easier for people to understand a chart than raw numbers.
🔹 Correlation vs Causation
Just because two things happen together doesn’t mean one caused the other.
📌 Example: Ice cream sales and drowning cases go up in summer—but ice cream doesn’t cause drowning. This is correlation, not causation.
🔹 Statistical Analysis
These are basic math techniques like mean, median, standard deviation, or more advanced ones like regression. They help you understand patterns in the data.
🔹 ETL Process (Extract, Transform, Load)
This is a common workflow:
- Extract data from different sources
- Transform it into a usable format
- Load it into a tool or database for analysis
Top Skills You Need to Become a Data Analyst
Here are the must-have skills for starting and growing in this career:
🔹 Analytical Thinking
You should enjoy solving problems and finding patterns in information.
🔹 Excel & SQL
These are the foundation tools for handling data—use Excel for spreadsheets and SQL to get data from databases.
🔹 Python or R
Both are programming languages used to automate tasks and run deeper analysis. Python is more widely used in jobs and companies.
🔹 Data Visualization
Being able to present your insights visually is key—learn tools like Power BI, Tableau, or even basic Excel charts.
🔹 Attention to Detail
Missing one wrong number can give false results. A good data analyst double-checks everything.
🔹 Communication Skills
You’ll often need to explain complex insights in simple terms to managers or clients who aren’t technical.
How to Learn This Skill?
- Kaggle – Real-world datasets and free courses
- Google Data Analytics Series (YouTube) – Beginner-friendly videos
- NPTEL – Government-backed courses on data and computing
- ✅ Learn Data Analysis on Udemy – Affordable, beginner to advanced
- ✅ Coursera – IBM Data Analyst Certificate – Recognized globally
- ✅ Skillshare – Data Skills for Beginners – Great for short and creative courses
- Learn Excel basics
- Practice with Google Sheets
- Understand simple SQL queries
- Learn Python for analysis (Pandas, NumPy)
- Create charts using Power BI or Tableau
- Understand statistics like averages, correlations
- Try machine learning basics (like linear regression)
- Do projects with real-world data
- Learn industry knowledge (e.g., marketing, finance, health)
- Start small and stay consistent
- Upload projects to GitHub as your portfolio
- Share insights on LinkedIn to get noticed
- Earn certifications to improve your chances of getting hired
|
Feature |
Free Path |
Paid Courses (e.g., Udemy/Coursera) |
| Access to Content | Limited/Scattered |
Structured & Organized |
|
Certification |
Not always available |
Recognized industry certs |
|
Mentorship & Support |
Community forums |
Expert Q&A and support |
| Time Efficiency |
Slower, self-paced |
Faster, guided tracks |
Common Mistakes to Avoid When Analyzing Data
Avoiding these mistakes will help you become a trusted data analyst:
❌ Skipping data cleaning – Dirty data leads to wrong insights
❌ Misinterpreting visualizations – Don’t assume charts always tell the full story
❌ Ignoring the business goal – Always link your analysis to the original objective
❌ Overfitting models – Avoid making your model too complex for small datasets
❌ Using the wrong method – Pick the right tool or technique based on the question
How to Start Practicing Data Analysis Today (Simple Action Plan)
You don’t need to wait for a job or degree—start building your skills right away!
- 🎯 Pick a Tool: Start with Excel or Python (whichever you’re comfortable with)
- 📥 Download a Dataset: Try free sites like Kaggle or Google Dataset Search
- 🔍 Analyze It: Try basic tasks like finding averages, counts, or trends
- 📊 Visualize Your Findings: Create graphs or dashboards to showcase your work
- 🌐 Share Publicly: Post your work on LinkedIn or GitHub to build your portfolio
How to Get Work / Job Opportunities
Once you have skills and some practice, here’s how to start earning:
🟢 A. Job Portals
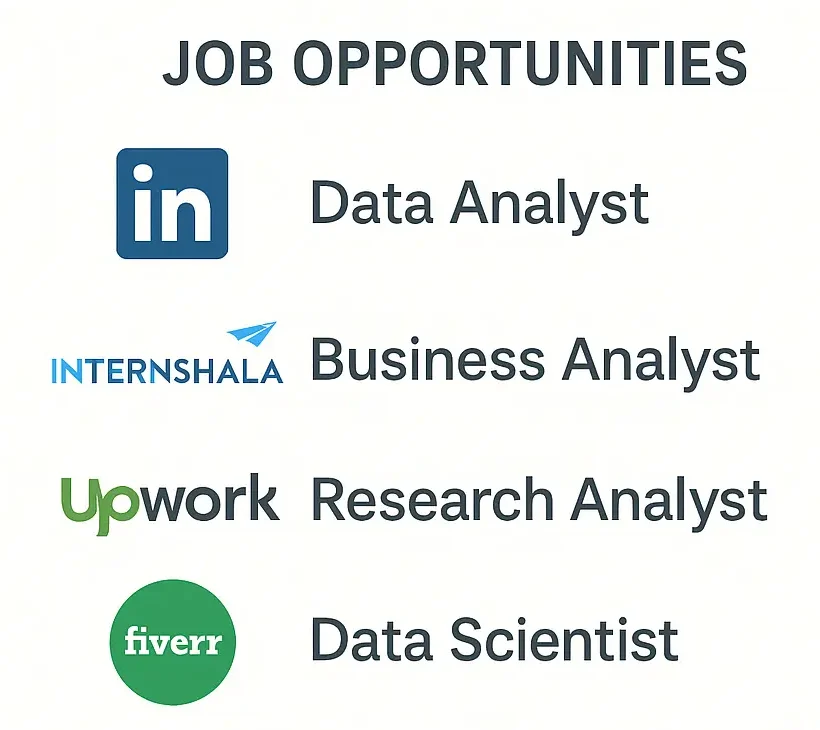
These websites are great for internships, fresher roles, and remote jobs:
- Internshala
- Indeed India
- Upwork – Freelance gigs
- Fiverr – Micro services
🟢 B. Freelance / Startup Tips
- ✅ Create a simple personal brand (LinkedIn bio + project posts)
- ✅ Offer free trials or discounted work to get your first client
- ✅ Start with simple services like making dashboards for small businesses
- ✅ Set prices based on value (not time) and explain what results you deliver
🟢 C. Govt / Private Sector Routes
- Apply via NASSCOM FutureSkills
- Check govt exams that focus on IT/data roles (like SSC, NIC, ISRO)
- Apply through campus placements or company career pages
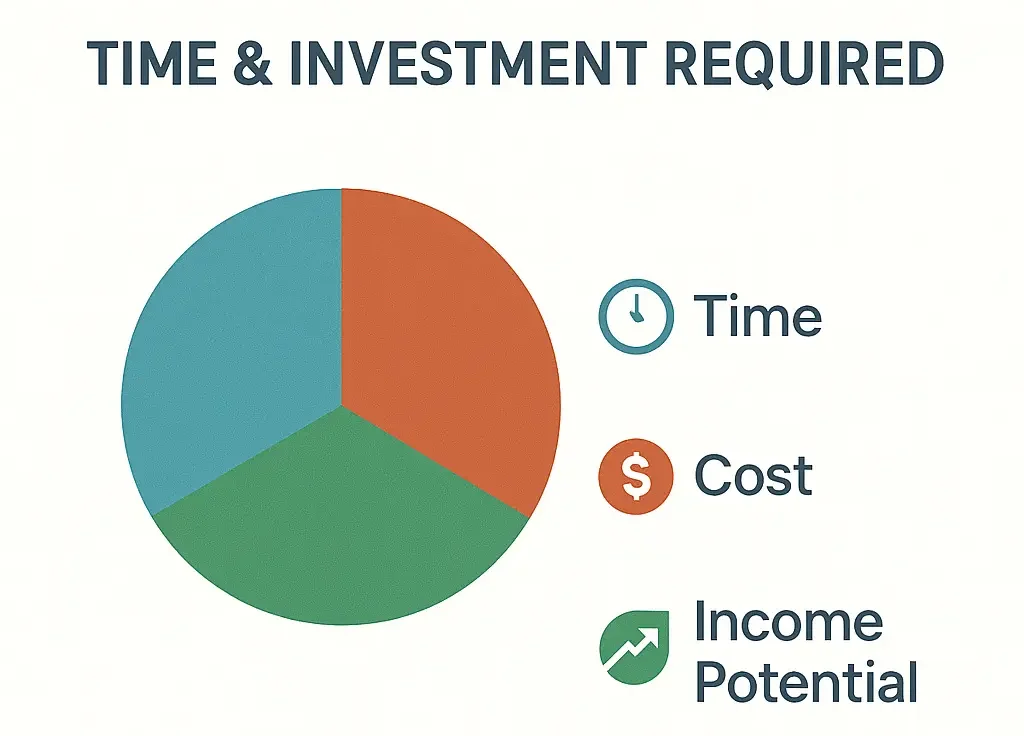
Time & Investment Required
Before jumping into any new skill, it’s smart to understand how much time, effort, and money you’ll need—and what kind of income you can expect in return. Here’s a breakdown for becoming a Data Analyst in India:
Factor | Details |
Duration to be Job-Ready | 3 to 8 months, depending on your learning pace and prior knowledge. If you’re consistent with 1–2 hours daily, you can become job-ready in under 6 months. |
Skill Difficulty | Moderate. It’s not too hard, especially if you enjoy working with numbers and patterns. Programming knowledge is helpful but not mandatory at the start. |
Cost Estimate | Ranges from ₹0 (Free Resources) to ₹20,000 (Paid Courses). Many people start for free, then later invest in certifications or advanced courses. |
Income Potential | Entry-level data analyst salary in India typically starts at ₹3.5 – ₹6 LPA, and experienced analysts can earn ₹8–15 LPA or more. Freelancers may charge ₹500–₹1500 per hour depending on skill and niche. |
📝 Quick Tip:
- Free path is ideal if you’re exploring or tight on budget.
- Paid path gives you structured learning, certificates, and faster results—ideal if you’re career-focused.
Final Thoughts: The Future of Data Analysis
As we move into 2025 and beyond, data analysts are becoming one of the most in-demand roles across industries. Companies now realize that decisions based on data are smarter and more reliable than decisions based on guesswork.
Here’s what the future looks like:
🔹 More Opportunities in AI & Automation
As artificial intelligence and machine learning grow, data analysts will be needed to prepare, clean, and interpret data for these smart systems. Every AI model depends on quality data behind the scenes.

🔹 Rise of Business Analytics & Decision Intelligence
More businesses—from startups to large companies—are using analytics to plan everything: marketing campaigns, budgets, hiring, and more. Data analysts will play a key role in helping businesses grow smartly.
🔹 Remote Work & Freelancing
With tools like Excel, SQL, Power BI, and Python, many data analysts now work remotely or as freelancers. You can build a solid income by offering your skills online.
🔹 Career Growth & Salary Potential
- Starting Salary in India: ₹3.5 LPA to ₹6 LPA
- Mid-Level (3–5 yrs): ₹8 LPA to ₹12 LPA
- Senior Level / Managerial: ₹15 LPA or more
Freelance Earnings: ₹500–₹1500/hour depending on your experience and niche.
💡 Business Analyst vs Data Analyst
Understanding the difference helps you decide your career path:
Role | Focus Area |
| Business Analyst | Understands business problems and gives strategic solutions (less technical, more planning) |
| Data Analyst | Works directly with data to find patterns, trends, and insights (more technical, coding + tools) |
👉 You can start as a data analyst, then grow into a business analyst or data scientist later if you wish.
If you’re also interested in monetizing your skills, check out more income ideas, click here.
Frequently Asked Questions (FAQs)
Start with the basics: learn Excel, SQL, and Python. Then build small projects, take online courses, and earn certifications.
No experience? No problem. Practice with free datasets on Kaggle, build your portfolio on GitHub, and share your work on LinkedIn.
Yes, it’s possible. Use free and paid online courses, gain practical skills, and prove your knowledge through projects. Many companies now hire based on skills, not degrees.
Most entry-level data analysts earn ₹3.5 LPA to ₹6 LPA depending on location, company, and skills.
You can start learning data analysis right after 12th by picking up Excel, Python, statistics, and data visualization. Choose a related degree or build freelance experience.
Use free learning sites like Kaggle, YouTube (Google Analytics series), and NPTEL. Practice with real data and contribute to open-source projects
Here’s the updated path:
Excel → SQL → Python → Visualization (Power BI/Tableau) → Projects → Portfolio → Job/Internship
- Business Analyst: Focus on planning, strategy, and process improvement.
- Data Analyst: Focus on technical analysis of data and reporting insights.
